
About the app
See your electricity usage at a glance and in detail

Before
"Ummm."
"I won’t know how much electricity I’ve used until my end of year bill arrives."

After
"YEAH!"
"I can check my electricity usage easily on the Gateway LED or in detail using the app."
Smartphone app display
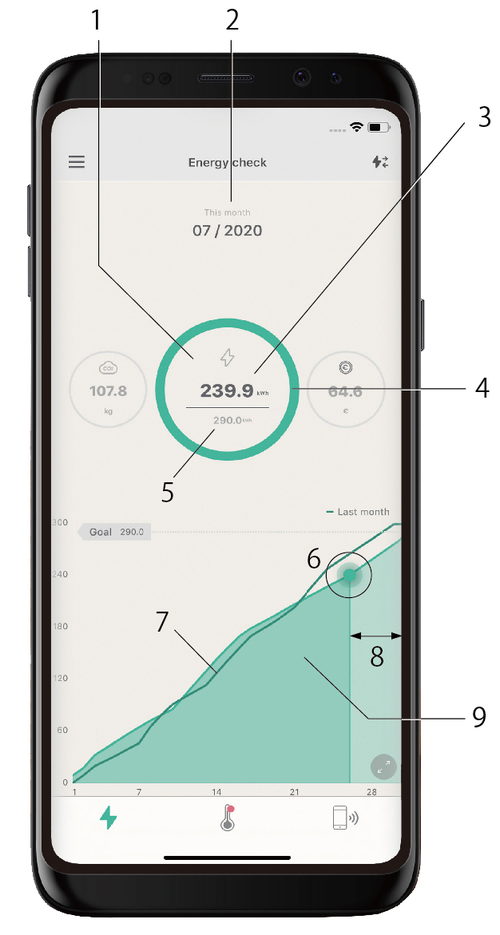
- Cumulative total so far
- This month
- Displays usage, cost and CO2emissions
(more details see below) - Consumption is colour coded for ease of use
(more details see below) - Target for current month
- Today’s figure
- Figure for previous month
- Prediction
- Current month’s electricity usage data and prediction graph.
Displays the cumulative total for electricity usage in the current month. The period from the following day to the end of the month is shown as a prediction. The prediction helps you to check whether you will meet your target.
* Prediction values are displayed once 6 days or more power data is available.
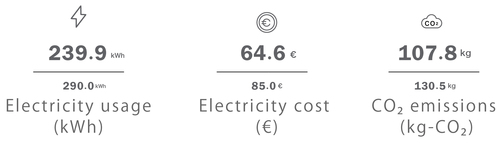
Displays usage, cost and CO₂ emissions
Tapping on the 3 circles switches between electricity usage, cost and CO2 emissions.
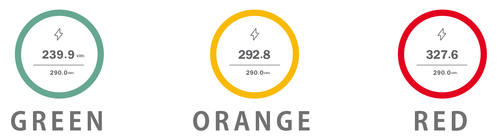
Consumption colour code
The current month’s electricity usage is displayed as 3 colours.
- GREEN
Below 100% of the target electricity usage for this month - ORANGE
101% ~ 109% of the target electricity usage for this month - RED
Over 110% of the target energy electricity for this month
Power measuring unit
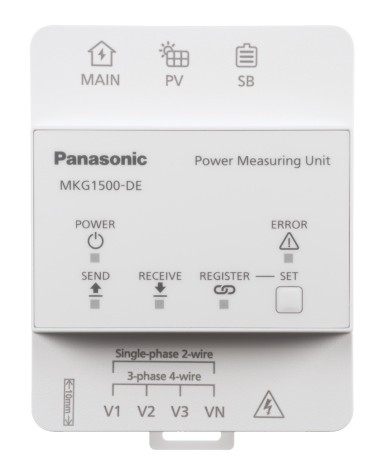
In addition to the Home IoT Gateway (MKG100C913), the Basic Plan includes a Power Measuring Unit (MKG1500-DE).
Installation and initial setup requires a specialist installer.
Smartphone App guide and catalogues
| Name | File type | Größe | Date | Language |
|---|---|---|---|---|
| HOME IoT Smartphone Application guide (English) Ver1.0.0 | 2MB | English | ||
| HOME IoT Smartphone Application guide (German) Ver1.0.0 | 2MB | English | ||
| HOME IoT Flyer (English) Ver1.0.0 | 4MB | English | ||
| HOME IoT Flyer (German) Ver1.0.0 | 3MB | English |